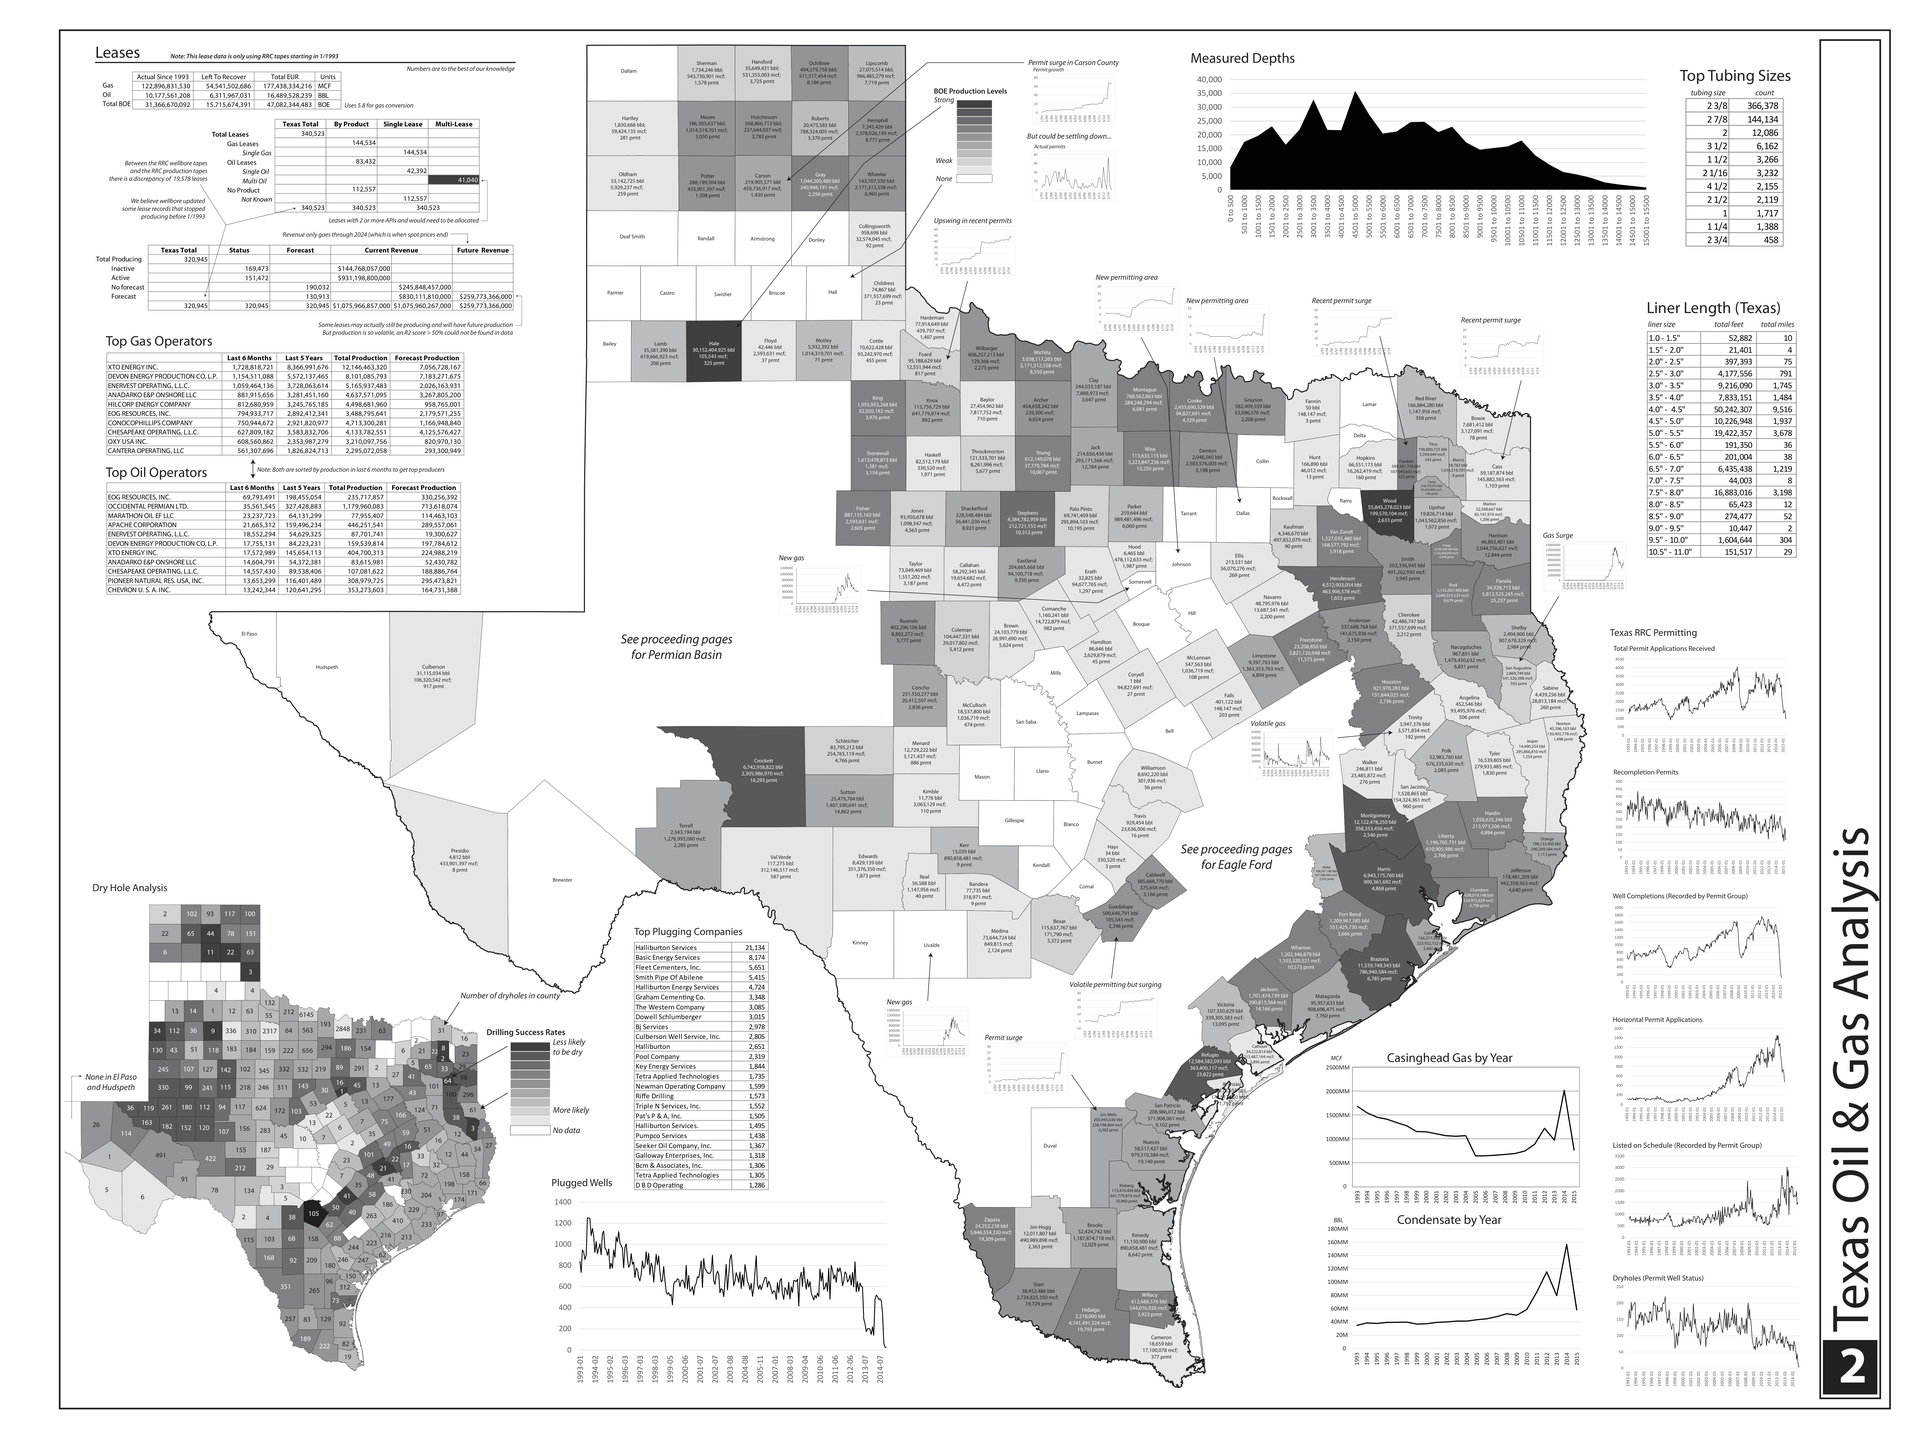
Market Dominance and Revenue Projections:
This comprehensive analysis of Texas oil and gas operations highlights massive historical lease yields, totaling over 173 billion MCF of gas and 16 billion barrels of oil. Major operators like XTO Energy and EOG Resources dominate production volumes. Future revenue forecasts indicate immense asset values, guiding strategic investment, infrastructure planning, and resource allocation across the state's major basins.
|
Geographical Assets and Permitting Trends:
Geographic distribution across Texas counties reveals localized production hotspots and distinct regional trends. Significant permit surges in areas like Carson County signal localized upswings, while specific regions transition toward volatile gas or new gas plays. This spatial intelligence allows producers to optimize drilling strategies, target high-yield formations, and navigate regional regulatory landscapes with enhanced precision and foresight.
|
Technical Operational and Lifecycle Metrics:
Technical metrics show critical operational dimensions, including measured depths peaking around ten thousand feet and standardized tubing sizes. Tracking dry hole statistics, plugging company performance, and RRC permit trends helps operators manage lifecycles. Analyzing historical casinghead gas and condensate declines over time provides vital benchmarks for optimizing mature assets and forecasting future production and well performance.
|