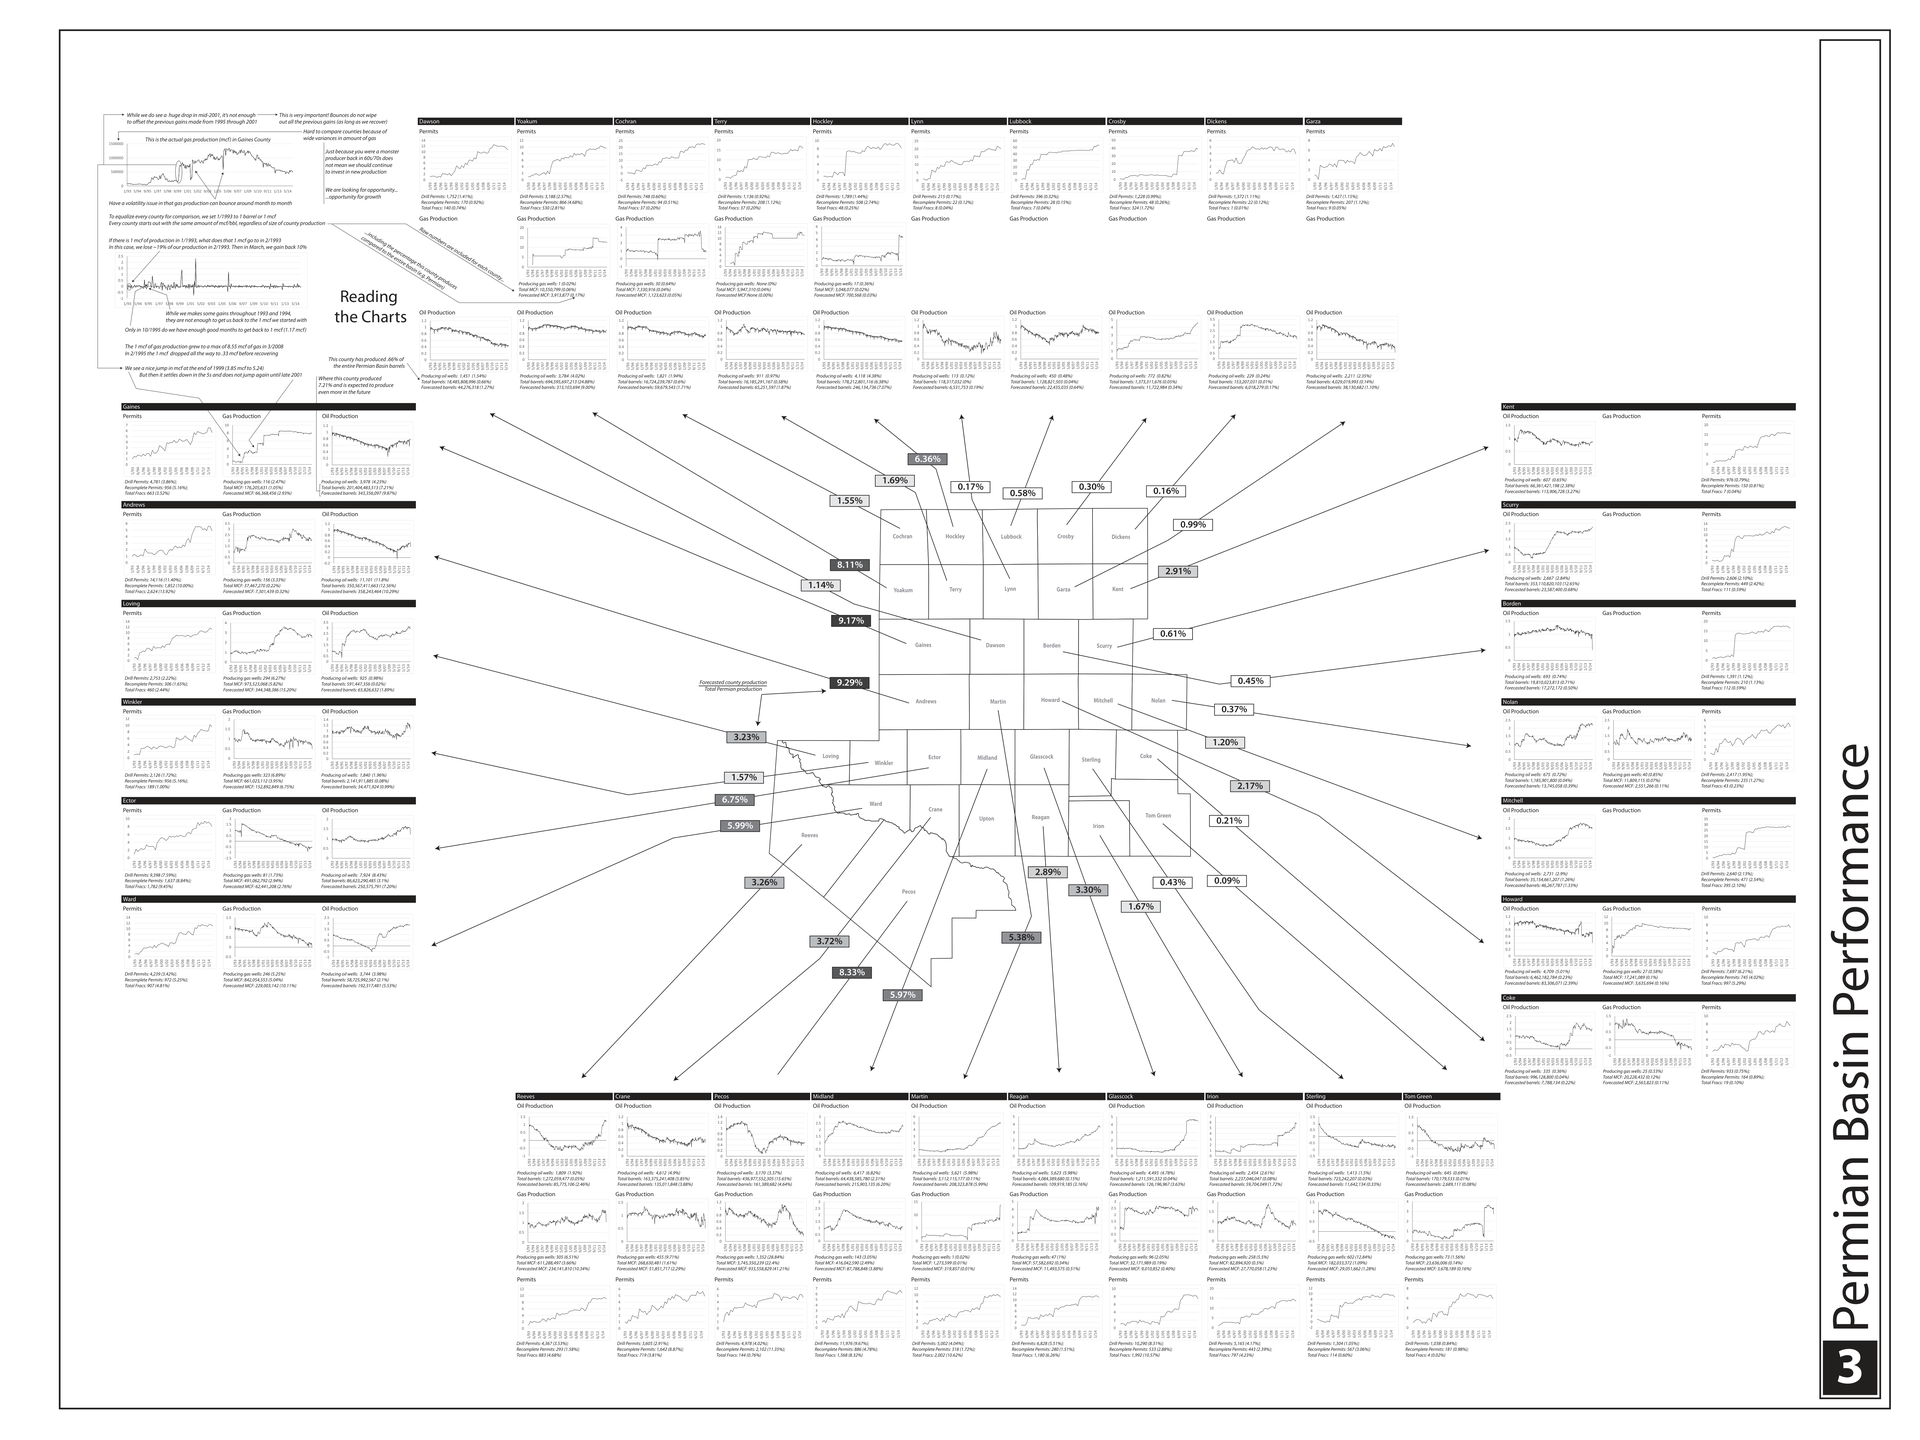
Geographic Production Hubs:
This comprehensive performance map of the Permian Basin highlights significant regional concentration. Powerhouse counties such as Andrews, Gaines, and Pecos dominate output, commanding large percentage shares of total basin yield. Analyzing these localized hotspots allows energy operators to optimize resource allocation, target infrastructure developments, and prioritize valuable drilling permits in areas of proven geological wealth.
|
Tri-Asset Trend Modeling:
The dashboard tracks critical operational metrics across three core pillars: drilling permits, gas production, and oil output. Examining these historical curves reveals vital correlations between permitting cycles and eventual extraction volumes. Recognizing these timelines helps operators anticipate infrastructure bottlenecks, manage supply chains, and align extraction schedules with broader market demand fluctuations to maximize overall profitability.
|
Data-Driven Strategic Forecasts:
Historical volatility across counties underscores the necessity of robust risk mitigation and strategic planning. By evaluating long term trends alongside short term fluctuations, stakeholders can identify sustainable growth corridors and avoid over allocating capital to declining sectors. This data driven perspective transforms historical raw data into actionable intelligence, securing a competitive advantage in an ever shifting global energy landscape.
|